psychHypergraph implements information-theoretic hypergraph analysis for psychometric data, based on Marinazzo et al. (2024) and Possenti et al. (2026). The package provides tools for constructing psychometric hypergraphs, identifying synergistic and redundant higher-order interactions, centrality analysis, clustering, and visualization.
Installation
# install.packages("remotes")
remotes::install_github("rheniumyuan/psychHypergraph")
Key Features
-
Hypergraph construction via
build_hypergraph(): a complete pipeline that preprocesses data, generates candidate hyperedges, computes O-information, and performs three-step hyperedge validation and selection (permutation test, bootstrap stability assessment, and hierarchical validation) (Possenti et al., 2026). - O-information: an information-theoretic measure proposed that quantifies the balance between redundant and synergistic higher-order statistical dependencies among variables (Rosas et al., 2019).
- Multiple candidate generation strategies: implements exhaustive search and clique-based candidate generation strategies.
-
Node degree centrality via
node_degree(): calculate node degree centrality for each node. -
Spectral clustering via
spectral_clustering(): perform spectral clustering (similar toHySCin python libraryhypergraphx (HGX)) on hypergraphs. -
Visualization:
plot()for hypergraph visualization (based onHyperGpackage),plot_hyperedge()for forest plots of O-information estimates, andplot_node_degree()for centrality profiles.
Example
Constructing a psychometric hypergraph
library(psychHypergraph)

# Load example data
data(bfi, package = "psych")

# Build a psychometric hypergraph using clique-based candidate generation
hg <- build_hypergraph(
  data = bfi[, 1:25],
  cor_method = "pearson",
  k = 3:4,
  candidate_method = "clique",
  n_perm = 100, # Reduced for faster example; use 1000+ for real analysis
  n_boot = 100,
  seed = 123,
  parallel = TRUE,
  n_cores = 12
)
#> Step 0/3: Preprocessing data...
#> Generating candidate multiplets using method: clique
#> Total candidate multiplets: 553
#> Step 1/3: Running permutation tests (n = 100)...
#> Step 2/3: Running BCa bootstrap validation (n = 100)...
#> Step 3/3: Running hierarchical validation...
#> Completed: Found 231 significant hyperedges.
#> Building hypergraphs...

# Inspect results
print(hg)
#> psychHypergraph Object Summary
#> ==============================
#>
#> Subjects: 2800
#> Variables: 25
#> Candidate Multiplets Evaluated: 553
#> Total Active Hyperedges: 231
#>   - Redundant (O-info > 0): 230
#>   - Synergistic (O-info < 0): 1
#>
#> O-Info Statistics:
#>   Range: [-0.013, 0.239]
#>   Mean (abs): 0.048
#>
#> Parameters:
#>   cor_method: pearson
#>   k: 3, 4
#>   Candidate selection method: clique
#>
#> Use $hypergraph to access full hyperedge list
#> Use $hyperedge_details to view complete test results
#>
#> To plot:
#>   plot(x)                    # Full hypergraph
#>   plot(x, type='redundant')  # Only redundant
#>   plot(x, type='synergistic')# Only synergistic
#>   plot(x, top_n=10)          # Top 10 by |O-info|
Analyzing the structure of the hypergraph
# Node degree centrality
plot_node_degree(hg, graph_type = c("synergistic","redundant"), style = "both")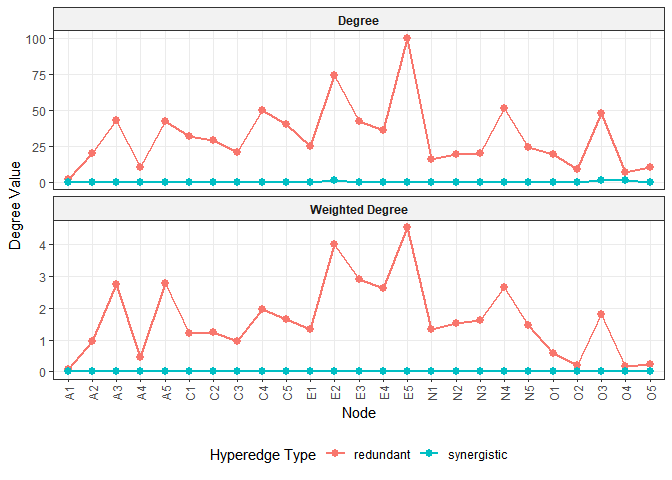
# Spectral clustering
clustering <- spectral_clustering(hg, K = 5)
print(clustering)
#> Hypergraph Spectral Clustering Results
#> =====================================
#> Number of nodes: 25
#> Number of hyperedges: 231
#> Number of clusters (K): 5
#> Clustering method: Binary Laplacian
#> Non-isolated nodes: 25
#> Isolated nodes: 0
#>
#> Cluster sizes:
#>   cluster size proportion
#> 1       1    5        0.2
#> 2       2    5        0.2
#> 3       3    5        0.2
#> 4       4    5        0.2
#> 5       5    5        0.2
#>
#> First few eigenvalues:
#> [1] 0.0000 0.2298 0.3111 0.3885 0.5502
Visualizing the hypergraph
# Visualize the hypergraph
plot(hg, top_n = 30, type = "full", vertex.size = 20, groups = clustering$membership)
#> Selected top 30 hyperedges by absolute O-info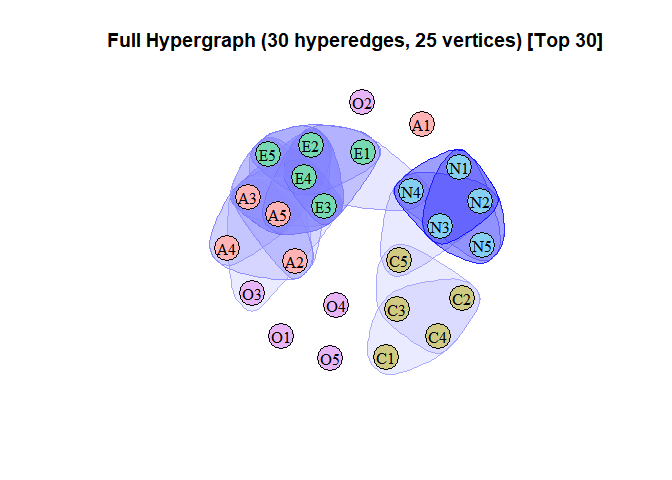
# visualize hyperedges
plot_hyperedge(hg, show_edge_label = FALSE, significant_only = TRUE)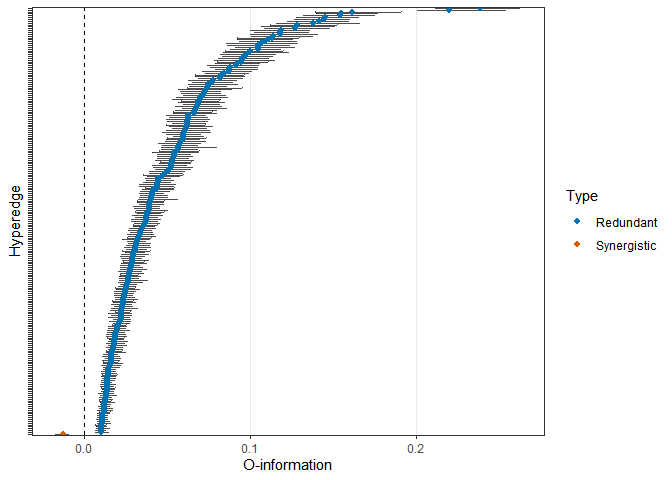
References
- Marinazzo, D., Van Roozendaal, J., Rosas, F. E., Stella, M., Comolatti, R., Colenbier, N., Stramaglia, S., & Rosseel, Y. (2024). An information-theoretic approach to build hypergraphs in psychometrics. Behavior Research Methods, 56(7), 8057–8079. https://doi.org/10.3758/s13428-024-02471-8
- Possenti, F., Girelli, L., Tieri, P., & Petti, M. (2026). Multiplex Hypergraph Modeling of Higher Order Structures in Psychometric Networks (Version 1). arXiv. https://doi.org/10.48550/ARXIV.2604.22744
- Rosas, F. E., Mediano, P. A. M., Gastpar, M., & Jensen, H. J. (2019). Quantifying high-order interdependencies via multivariate extensions of the mutual information. Physical Review E, 100(3), 032305. https://doi.org/10.1103/PhysRevE.100.032305